All of research,
all connected.
219M publications, 102M research data, 769K research software items, from 163K data sources, linked to 4M grants and 495K organizations
Deduplicated, linked, and searchable.
Jump straight to
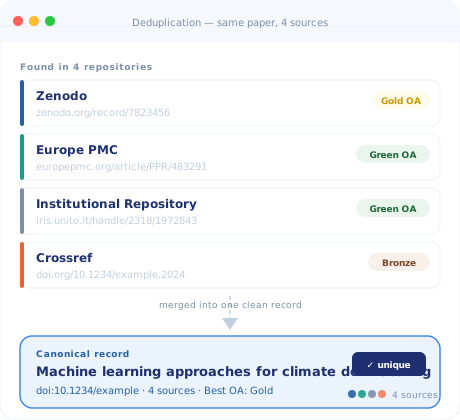
The same paper, a hundred sources - one clean result.
Most search tools show you duplicates and let you sort it out. We don't. Every record in OpenAIRE Explore has been deduplicated across all 160,000 sources, so your search results are clean, your counts are accurate, and your reports actually make sense.
-
One canonical record, many sourcesWhether a paper appears in 5 repositories or 50, you see it once. With all source links preserved underneath.
-
Accurate counts for reportingWhen you generate OA compliance reports, you're counting real outputs. Not inflated numbers from overlapping repositories.
-
Transparent provenanceYou can always see which sources contributed to a record. Nothing is hidden.
Not just a citation. The whole research story.
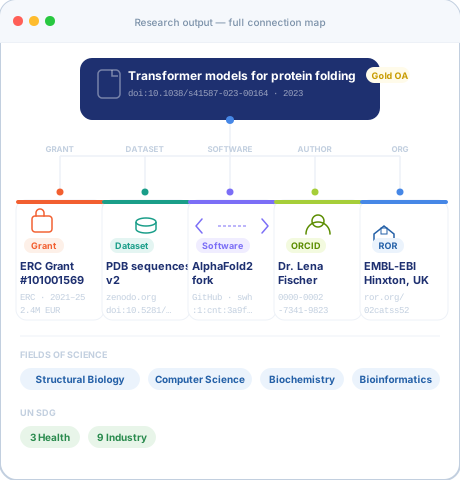
Every result in Explore links outward, to the specific grant that funded it, the datasets it was built on, the software it used, the researchers behind it (via ORCID), and the organisation they work for (via ROR). This isn't metadata. It's the full picture..
-
Linked to the specific grant, not just the funderSee the exact grant number, dates and budget, not just "funded by ERC".
-
Publications linked to datasets and softwareFollow the data trail. See the datasets and code a paper relied on. And vice versa.
-
Authors identified by ORCID, orgs by RORNo more "which John Smith?". Persistent identifiers mean every person and organisation is unambiguous.
Get a feel for any organisation's research footprint.
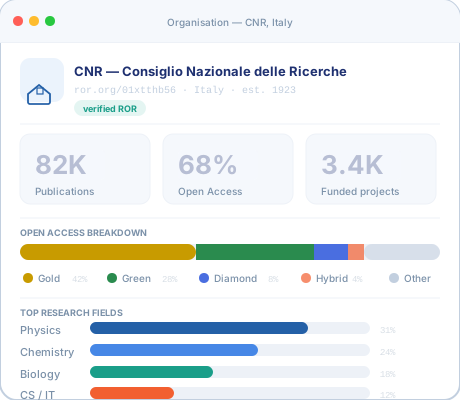
Search for any university, institute or research body and instantly see their output, open access performance, top fields, and connected projects. All drawn from the OpenAIRE Graph, no manual curation needed.
-
Output and OA stats at a glancePublication counts, open access breakdown, top research fields, for any organisation in the graph.
-
Researchers and collaborating organisationsSee who's active, which institutions they work with, and how the organisation fits in the wider research network.
-
Linked to their funded projectsSee all grants the organisation has been part of. Across all major European and national funders.
Show your project's outputs on your own site.
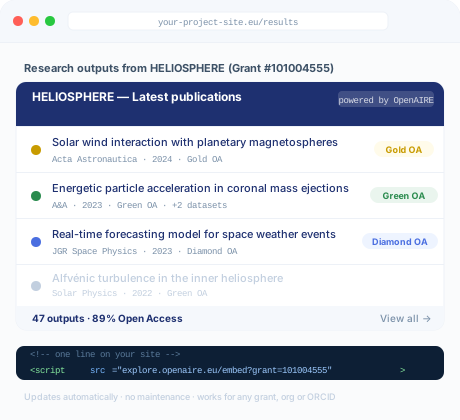
Running a Horizon project or a research programme? Paste one line of code into your website and get a live, auto-updating list of all publications, datasets and software linked to your grant. No maintenance, no exports, no copy-paste.
-
One <script> tag, that's itPoint it at your grant ID. The widget handles everything else - layout, updates, OA badges.
-
Always up to dateNew papers added to the graph automatically appear in your widget. No manual uploads.
-
Works for any grant or organisationFilter by grant ID, organisation ROR, or researcher ORCID. Mix and match.
The OpenAIRE Graph is open. Build on it.
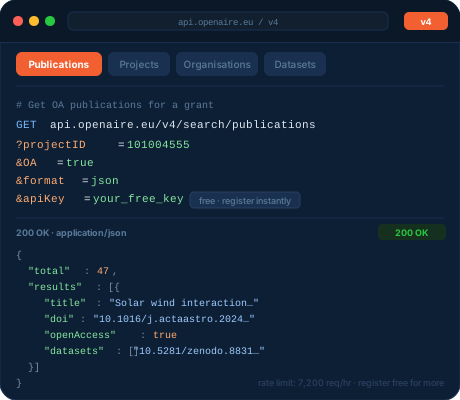
Every record in Explore is available through a clean REST API. An API key is required for access - but registration is free, instant and has no approval process.
-
Free API key - register in secondsAn API key is required for all access. Registration is free, open to everyone and has no approval process - you get your key immediately.
-
Search by DOI, ORCID, ROR or grant IDFilter by grant ID, organisation ROR, or researcher ORCID. Mix and match.
-
Bulk download the whole graph, CC-BYZenodo as JSON and Parquet, openly licensed, no negotiations. Also accessible via Google BigQuery through the ORION DBs community initiative.
See what research
is doing for the world.
Every record in Explore is classified by Field of Science and mapped to the UN Sustainable Development Goals - automatically, using AI. For the first time you can ask not just "what was published?" but "what did it contribute to?"
215M+ papers mapped to the 17 SDGs
Research aligned with global sustainability goals
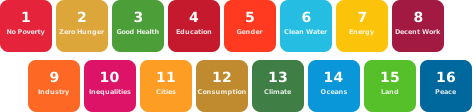
The classification scheme was developed specifically for the UN SDGs, mapping research contributions towards complex global challenges like climate change, biodiversity loss, pollution, and poverty reduction.
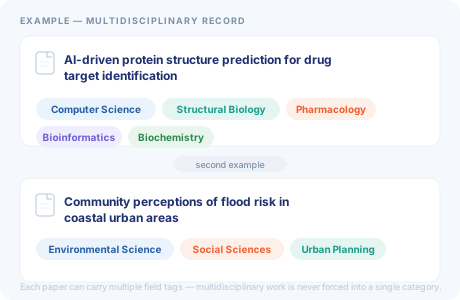
Fields of Science taxonomy - built into every record
Using full-texts, citations, references and venue signals, we apply AI to classify every paper by its field - and surface any multidisciplinary potential. So a paper on AI-assisted drug discovery doesn't get lost in either Computer Science or Biology alone.
Want your own national or community portal? We build and run it for you.
-
Your branding, your domainCustom logo, colours and URL. Looks like yours, powered by ours.
-
Scoped to your communityFiltered to your country, funding agency, or research community. Showing only what's relevant to you.
-
Always current with zero maintenance for youThe graph updates continuously. Your portal stays fresh without any effort on your side.
-
OA monitoring & in-depth research trackingTrack national or institutional open access compliance with built-in dashboards. Go further with in-depth research tracking - outputs by funder, field, SDG contribution, organisation and year. All in one place.